Income Landscapes: A Socioeconomic Mapping of Winnipeg Neighborhoods with ArcGIS Pro
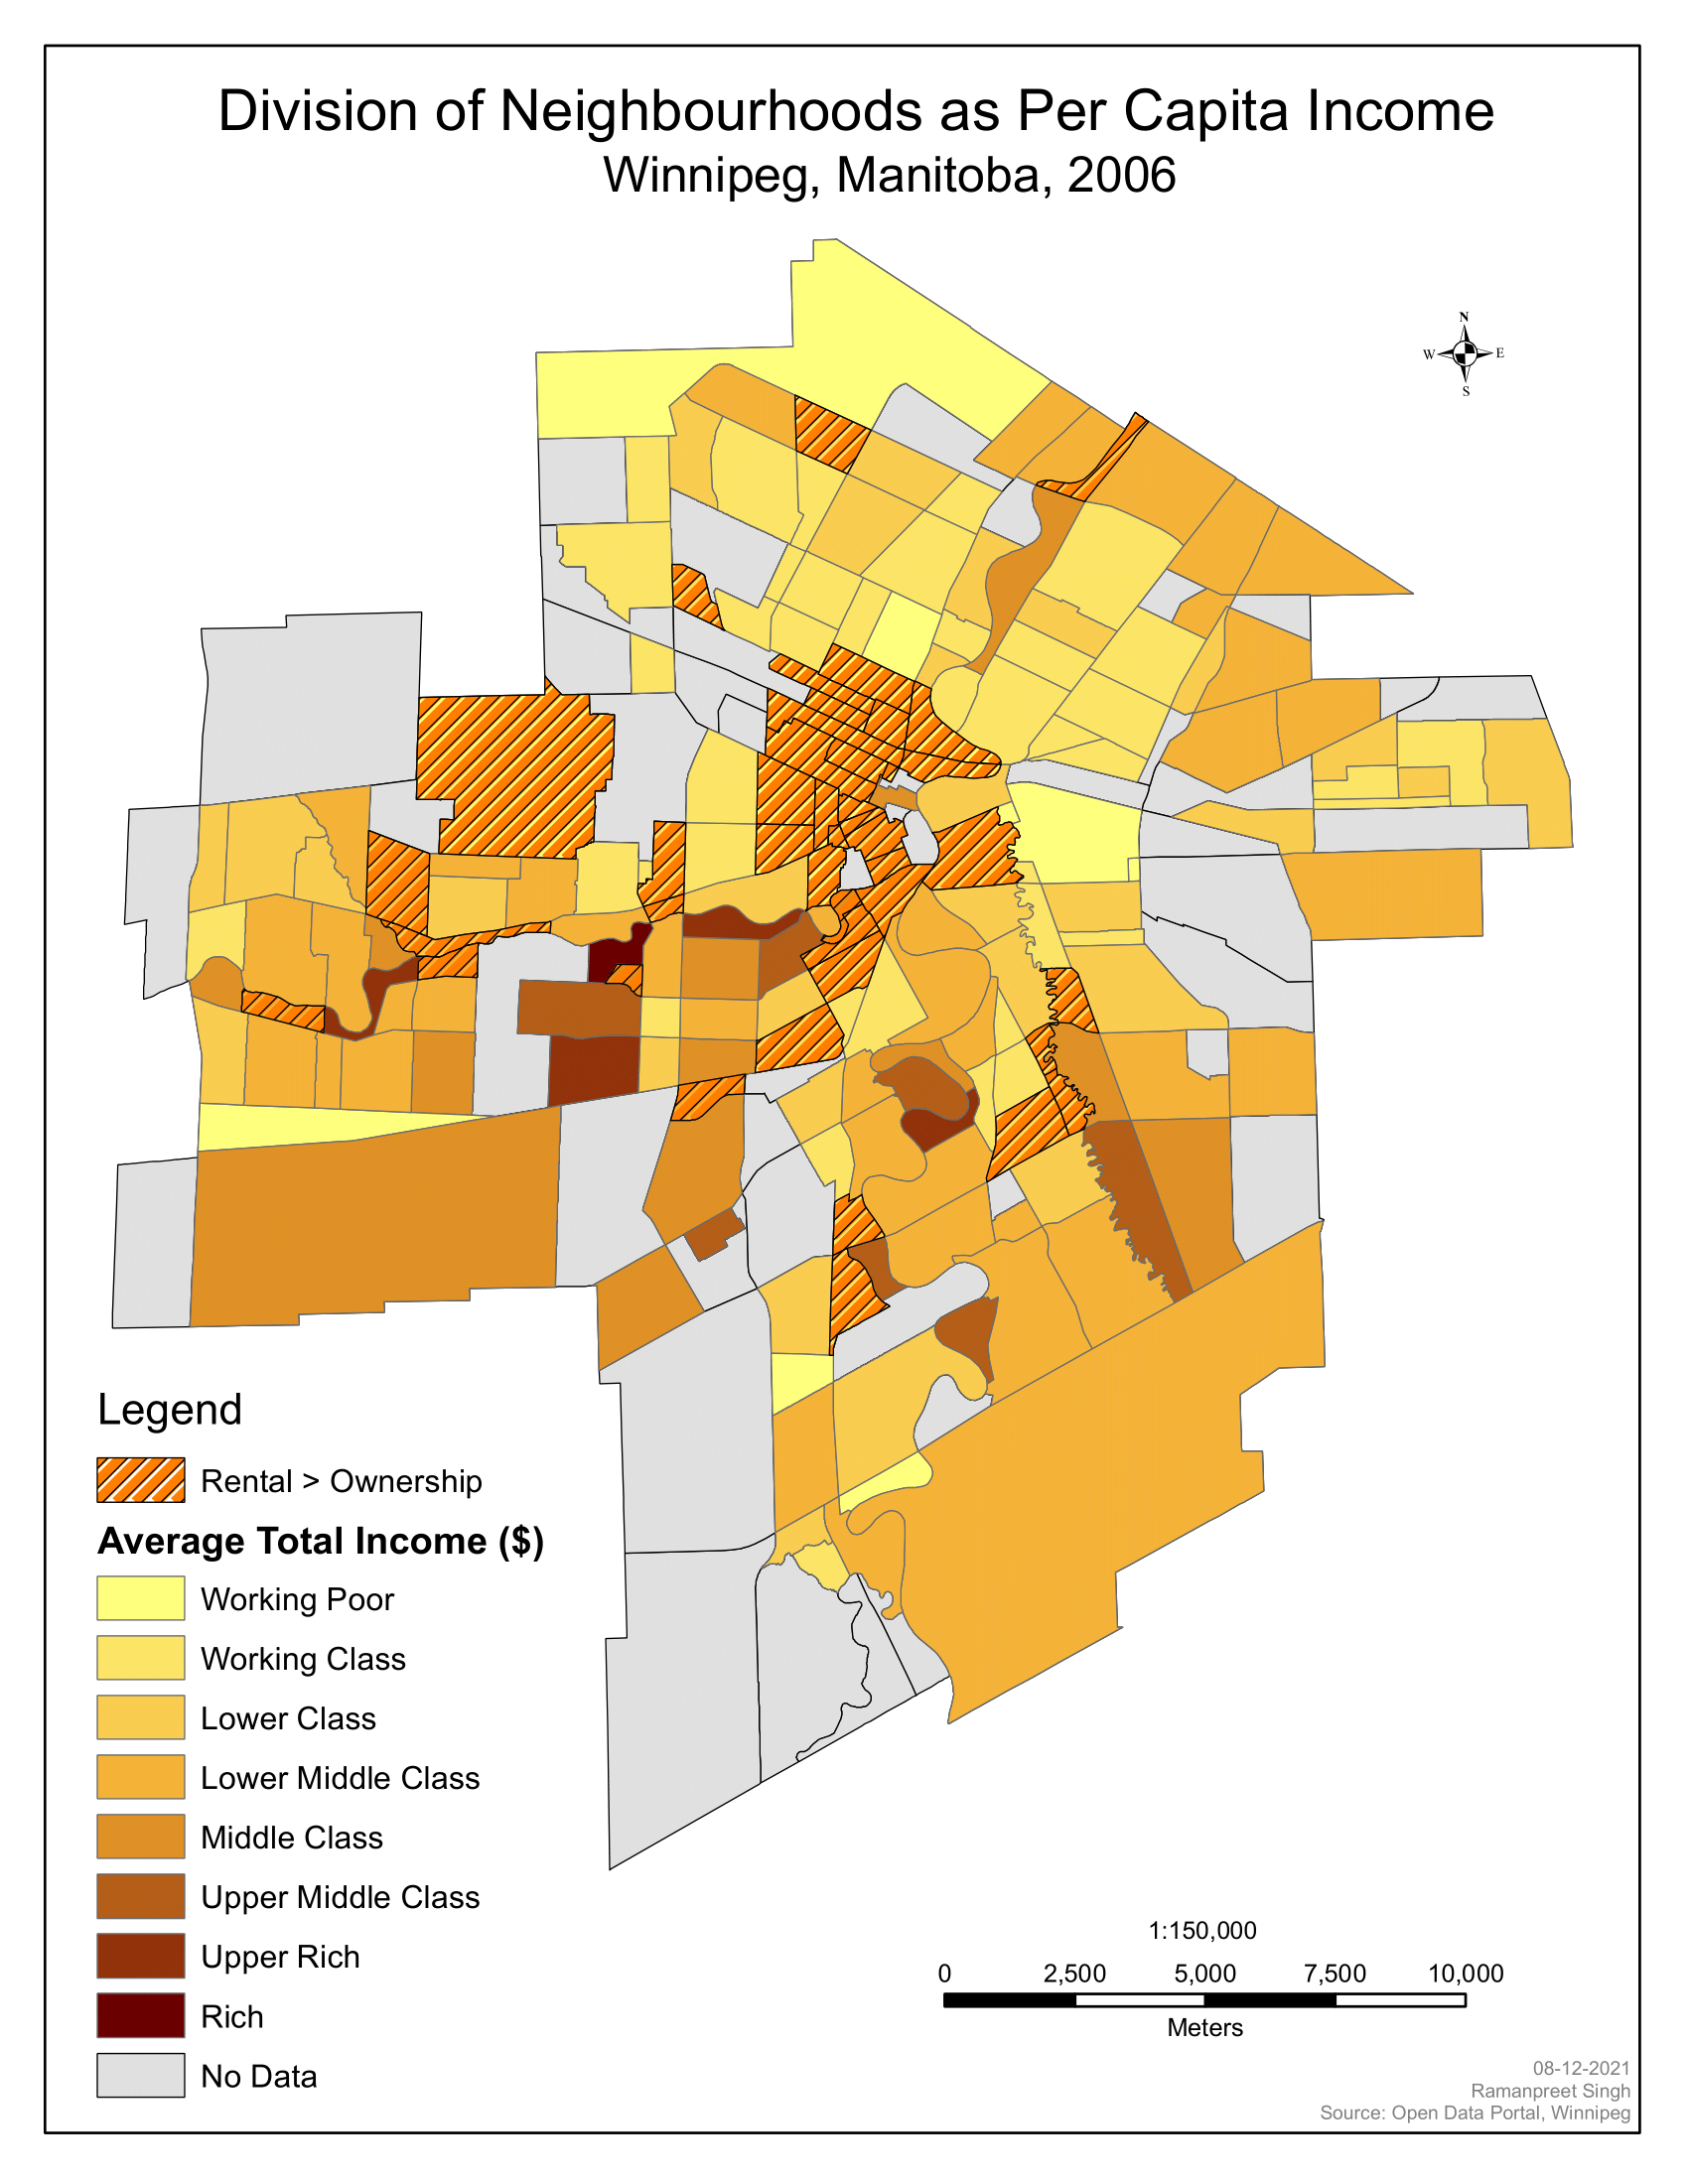
‘Income Landscapes’ is a project that uses ArcGIS Pro to map the division of neighborhoods in Winnipeg, Manitoba, Canada, based on per capita income data from 2006. The map is color-coded, with different shades of orange and yellow representing various income classes, including rental ownership, working poor, average total income, lower middle class, upper middle class, and rich. The project involved a detailed analysis of socioeconomic data to understand the distribution of wealth across different neighborhoods. This analysis was then visualized on the map, providing a clear picture of the economic landscape of Winnipeg. This project demonstrates the power of GIS in socioeconomic studies and urban planning.