Comparative Study of Population Distribution Using Graduated and Proportional Symbol Mapping with ArcGIS Pro
This project employs both Graduated and Proportional Symbol Mapping techniques to analyze population distribution in New Mexico, US. Created using ArcGIS Pro, this project provides a comparative study of these two popular mapping techniques.
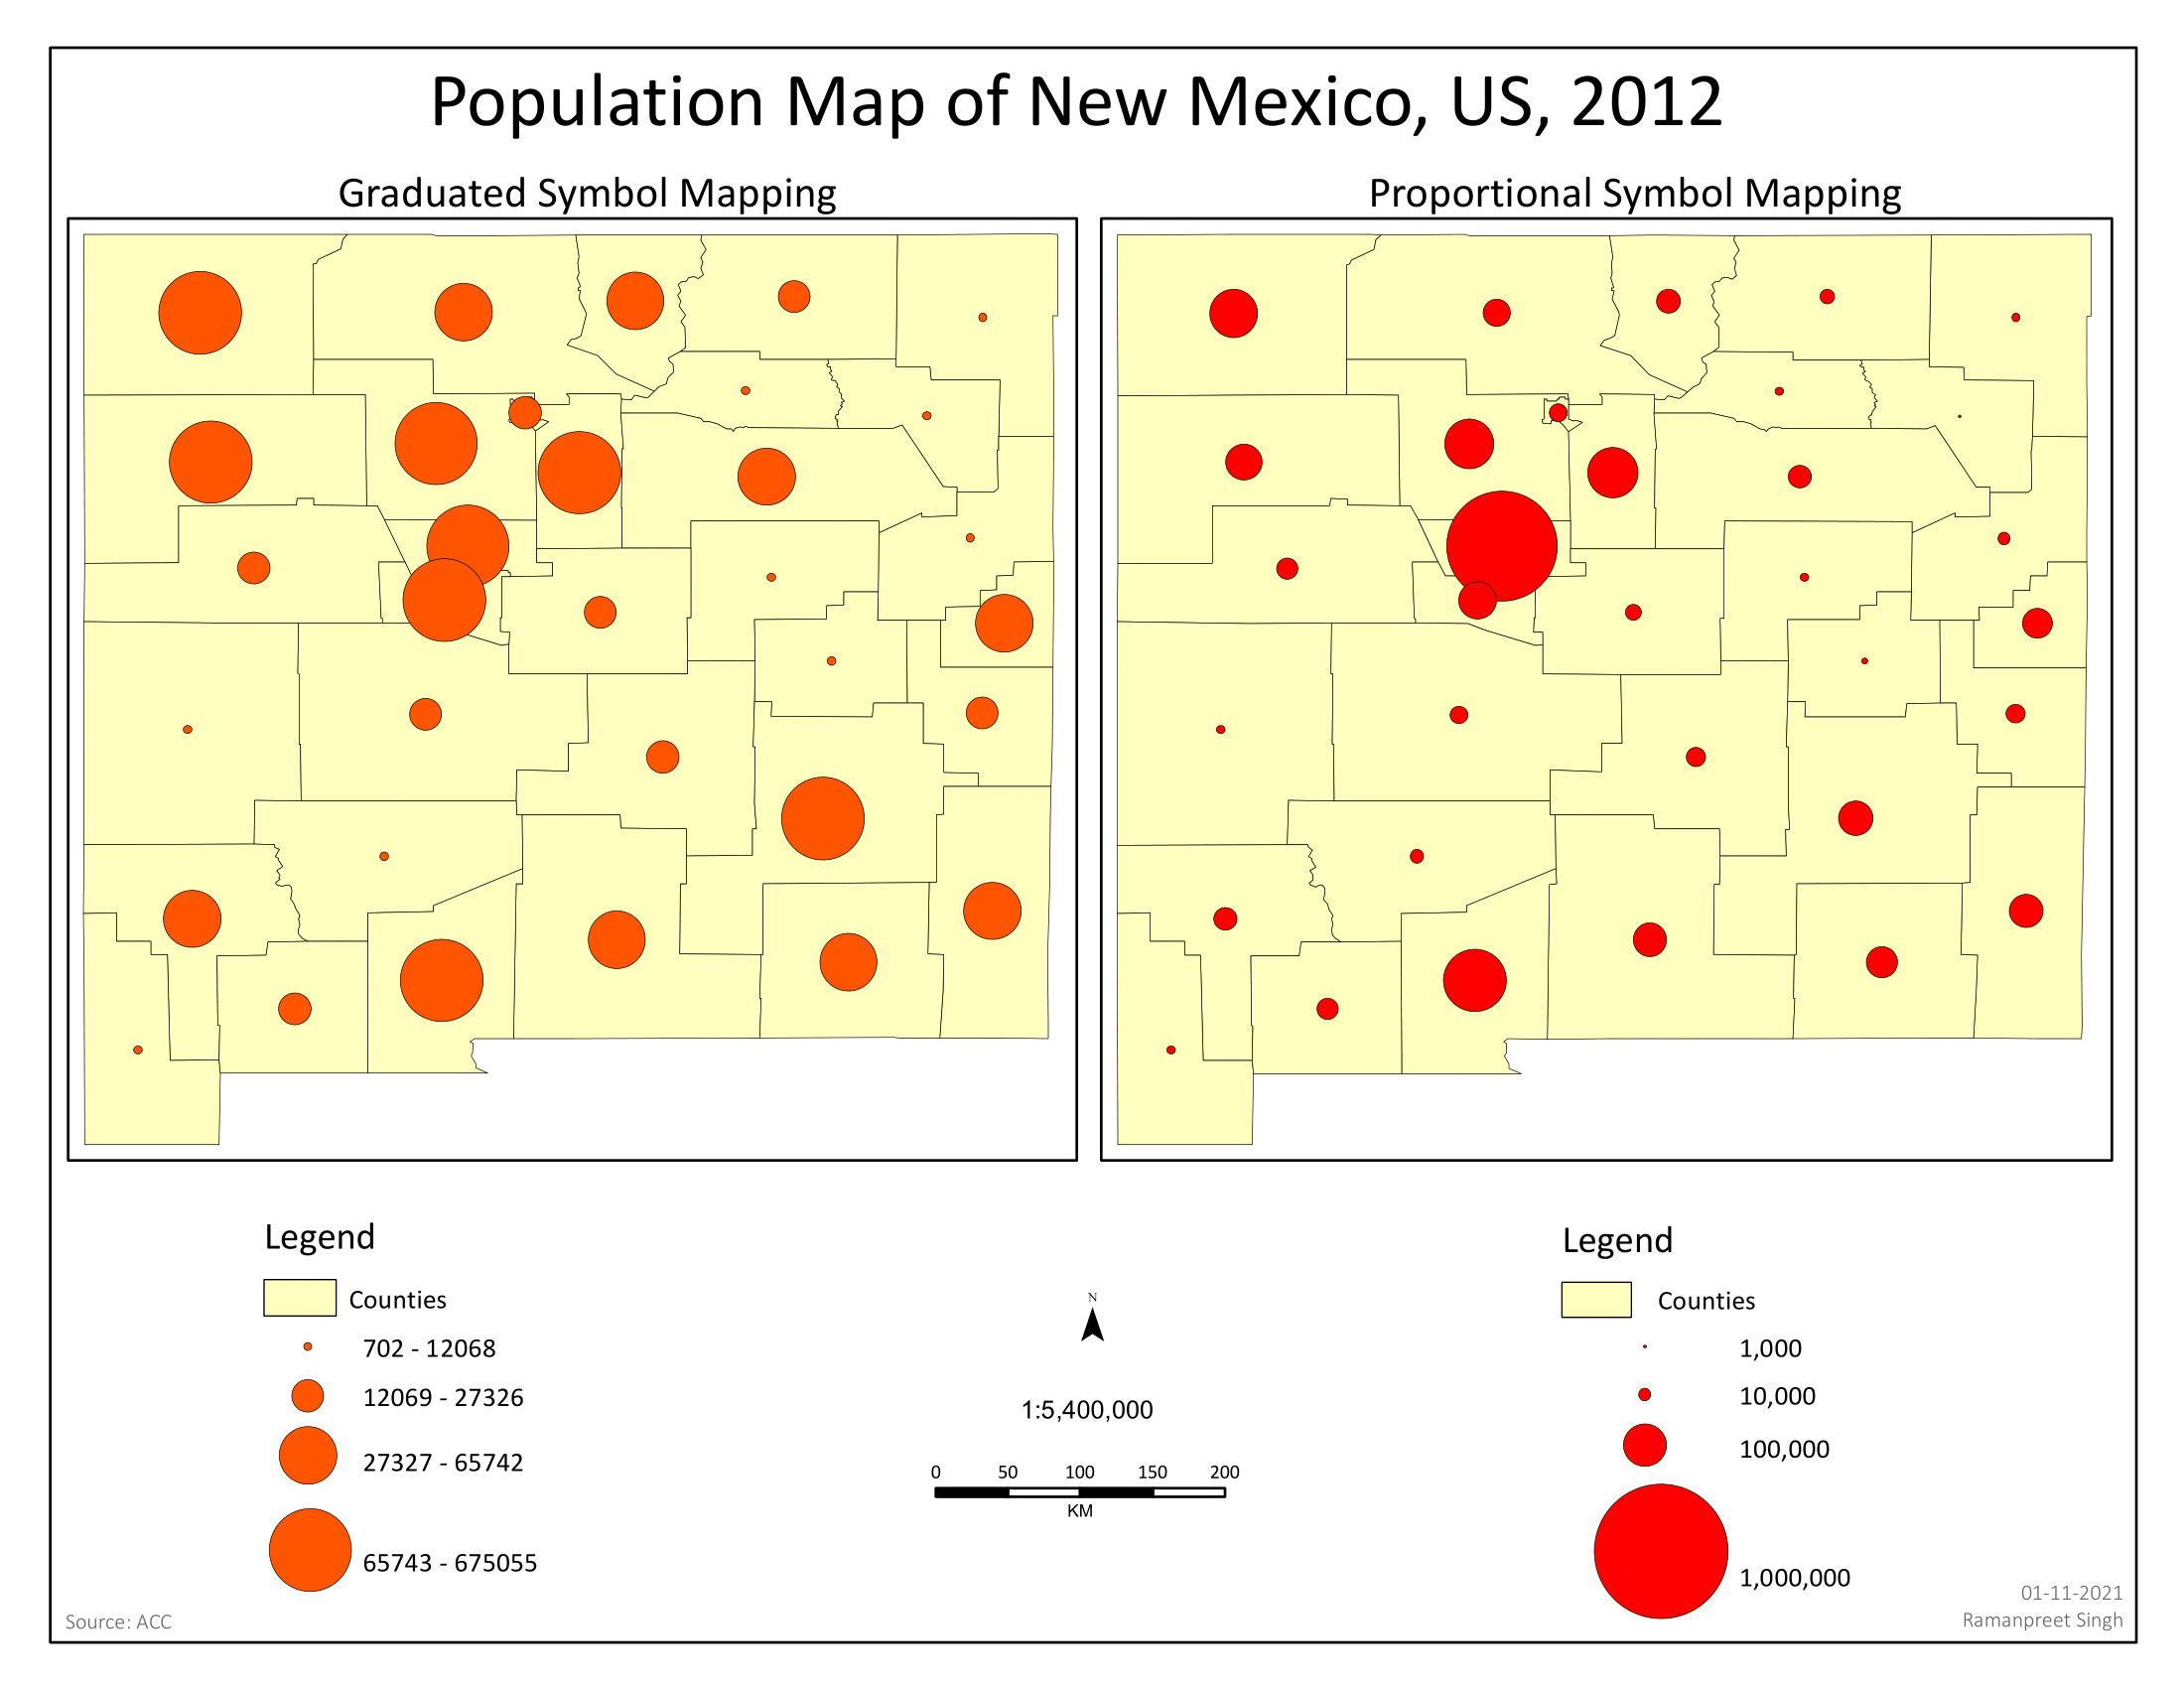
The map is divided into two sections - “Graduated Symbol Mapping” and “Proportional Symbol Mapping”, each offering a unique visualization of population density across different counties.
- Graduated Symbol Mapping: In this section of the map, we’ve used the Graduated Symbol Mapping technique. This method uses symbols of varying sizes to represent the relative magnitude of a particular attribute - in this case, population density.
- Proportional Symbol Mapping: On the other side of the map, we’ve employed Proportional Symbol Mapping. This technique uses map symbols that vary in size to represent a quantitative variable.